Every AI business case I have reviewed in the last two years produces a number for value. Hours saved, multiplied by a rate, presented as annual savings. Fewer than one in five produce a number for what the thing will cost to operate once it is live, and of those, almost none put a range on it.
This is strange, because the two numbers come from the same place. If you know a workflow well enough to estimate the hours a model will take out of it, you know it well enough to estimate how many times the model will be called and roughly how much each call will consume. The information is already on the table. Leaving the second number off is a choice, and it is usually the choice that gets a CFO to stop trusting the first number three months after launch, when the consumption invoice shows up.
I have spent the better part of a year building and refining a model that produces both numbers together, with a ramp and a range, and that is structured so that measurement replaces assumptions once the workflow is running. The paper attached to this piece lays it out in full, with the equations, a worked example, and a section on what I am confident about versus what I am still learning. This article is the short version: what the model does, why it is shaped the way it is, and what it revealed that I did not expect.
Start from the steps, not the workflow
The unit of analysis is a step: a thing a person does, with a measured number of hours per unit of work. A support request has an intake step, a triage step, a resolution step, and so on. Whole-workflow percentages (“AI will take out 40% of this”) hide the only argument that matters, which is what happens to each step.
For each step you choose one of four dispositions. An agent runs it. A copilot assists a human. A human does it with an AI brief. Or the step is eliminated because something upstream made it unnecessary. Each disposition removes a fraction of the step’s hours once the change has fully landed. The fractions are calibratable. The choice of disposition is not; it comes from knowing the workflow, the regulator, and who has to sign what. That choice is the actual consulting, and I have come to believe it is the only part of this exercise that cannot be automated.
Ramp both lines, not one
Nothing arrives on day one. Every step in the model has a start month, a ramp length, and a curve. The default is an S-curve, because that is how teams adopt tools: slowly, then quickly once the early users become references, then it saturates. A workflow-level scenario (conservative, expected, aggressive) shifts every step’s start and stretches or compresses every ramp, so the same judgment about which steps land early can be viewed under three rollout postures without re-entering anything.
The part that gets missed is that the ramp has to apply to the cost line as well. I have seen cases where value ramps over a year and run cost is assumed at full volume from month one, and the reverse. Both are wrong in ways that flatter or punish the case for no reason.
Price in units, and make the band lopsided
Run cost is runs per unit, times consumption per run, times a price. The billing unit is deliberately abstract. Some vendors bill in tokens with separate input and output prices; some bill per assist, per credit, or per seat. A model that hard-codes tokens has quietly chosen a vendor before the vendor selection.
The range around the estimate should be lopsided. Per-run consumption in agentic systems is right-skewed: loops, retries, tool chains, and long contexts push individual runs well above the typical one, and nothing pushes them below by the same amount. I use 0.75x on the low side and 1.6x on the high side as placeholders until telemetry provides the real P10 and P90. A symmetric plus-or-minus band is, in my experience, a reliable sign the estimate was made by someone who has not run these systems.
The part I did not expect: run cost is predictable in advance
Once the model existed, the first thing it showed me was a map. Whether run cost matters at all depends on two things: how many human hours a unit of work takes today, and how many units of consumption the model needs per run. Plot one against the other and two regimes appear.
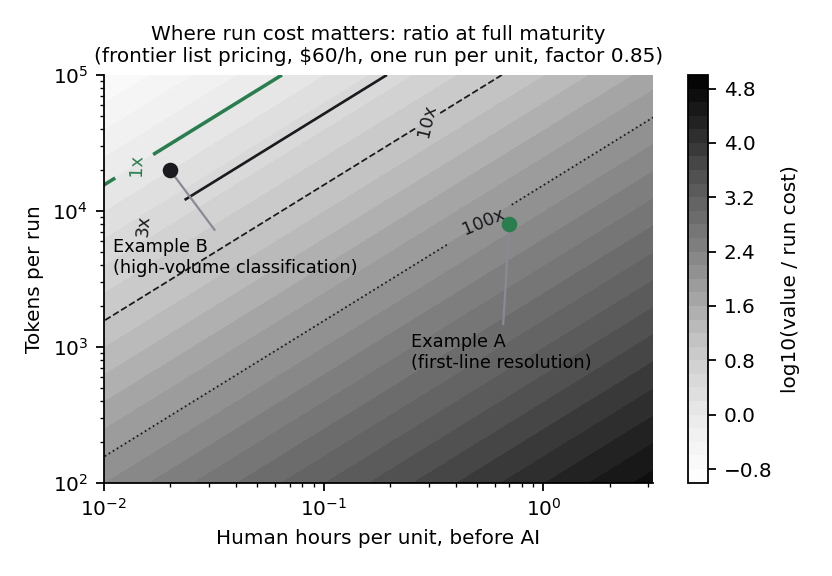
Labor-heavy workflows, where a step took a person twenty or forty minutes, return more than a hundred dollars of value for every dollar of run cost at frontier list prices. For these, the consumption band is a budgeting tool. The decision turns on adoption and on whether the dispositions survive the compliance review. Run cost is a rounding error.
High-volume, low-effort workflows are different. Classify half a million short items a month that each took a person a minute, with a big-context frontier model, and you are at roughly 1.5 dollars back per dollar spent. The high end of the band takes you negative. Here the consumption forecast is the business case, and the levers are model tier, context length, and runs per unit. The model tells you which regime you are in before anything is built.
I use 3x as the working threshold. Below it, the costs the model does not capture (review burden, error handling, platform fees) reliably eat what is left.
Forecast, measure, optimize
The reason to write the model down as equations rather than a spreadsheet is that every parameter in it has a measured counterpart. Hours per step come from time studies, then from timestamps on the residual human work. Runs per unit and consumption per run come from telemetry, if every model call is tagged with the step and the unit it served. The band becomes empirical within a month. The disposition factors update from observed hours, with shrinkage toward the prior so the first noisy weeks do not swing the case.
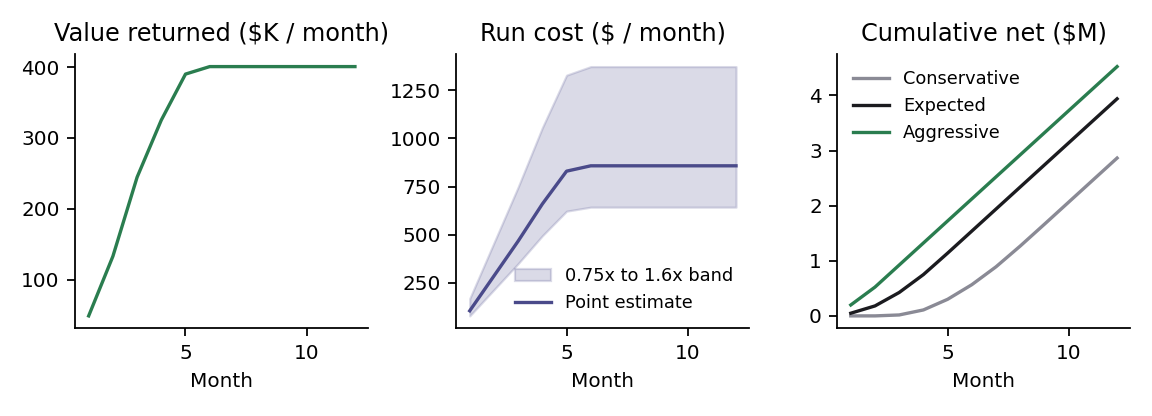
Then the optimization phase has something to act on. Caching and prompt hygiene reduce consumption per run. Model right-sizing reduces the price. Loop guards cut the right tail and narrow the band. Each of these has a predicted effect in the model, which makes each one testable. Forecast, measure, optimize, and the measurement becomes the next forecast. Vendors sell one piece of this loop and call it the whole thing.
What I am still learning
I want to be as clear about the open questions as the settled ones, so here is the short list from the paper.
The disposition factors I use (roughly 0.85 for agent-run, 0.45 for assisted, 0.15 for human-with-brief) are priors, not findings, and they almost certainly vary by domain. Calibrating them by domain is the most valuable thing this work could produce and I do not have enough post-deployment data to do it responsibly yet.
Returned hours are not savings. Some fraction becomes productive capacity, some becomes headcount change, some evaporates. The honest fix is a conversion coefficient on the value line, and I do not have a defensible prior for it beyond “less than one.”
Making a workflow cheaper often increases its volume. The model treats volume as fixed. It should not.
Steps interact. Better triage shortens investigation. The model is additive. And an automated step that is wrong some fraction of the time creates rework the model has no term for. For regulated workflows that may be the dominant unmodeled cost.
Human-kept steps sometimes get slower, not faster, when the AI brief has to be verified. The factor for that disposition may need to be allowed to go negative.
None of these change the structure. All of them are calibration, and calibration is what I expect to publish next.
Why this matters beyond one business case
If you build products, the regime map is a product-strategy tool. It tells you which workflows have room for a frontier model and which need a small one before they can exist at all. If you run a team, the two-number case is what survives a finance review. If you advise, the disposition step is the part clients pay for, and the model is how you show your work.
The paper has the full model, the invariants I recommend implementing as tests, the calibration procedure, and the worked examples. It is a working paper, version 0.1. If you have post-deployment data that would sharpen any of the open parameters, I would like to hear from you.
Cite as: Dillon, K. (2026). Forecast, Measure, Optimize: A Workflow-Level Model for the Value and Consumption of Agentic AI. Working paper v0.1, LatentAxis. DOI: 10.5281/zenodo.23197852. Paper page. PDF. Reference model (Python).
Related: The unit economics problem in enterprise AI and Governance is the strategy, not the checkbox.
